Satriadi, K.A., Smiley, J., Ens, B., Cordeil, M., Czauderna, T., Lee, B., Yang, Y., Dwyer, T., Jenny, B. 2021. Tangible Globes for Data Visualisation in Augmented Reality. In CHI ’22: ACM Conference on Human Factors in Computing Systems, April 30 - May 5 2022, New Orleans, USA. doi:10.1145/3491102.3517715
Tangible Globes for Data Visualisation in Augmented Reality
Kadek Ananta Satriadi, Jim Smiley, Barrett Ens, Maxime Cordeil, Tobias Czauderna, Benjamin Lee, Ying Yang, Tim Dwyer, Bernhard Jenny
CHI Conference on Human Factors in Computing Systems. New Orleans, USA. 2022.

Head-mounted augmented reality (AR) displays allow for the seamless integration of virtual visualisation with contextual tangible references, such as physical (tangible) globes. We explore the design of immersive geospatial data visualisation with AR and tangible globes. We investigate the 'tangible-virtual interplay' of tangible globes with virtual data visualisation, and propose a conceptual approach for designing immersive geospatial globes. We demonstrate a set of use cases, such as augmenting a tangible globe with virtual overlays, using a physical globe as a tangible input device for interacting with virtual globes and maps, and linking an augmented globe to an abstract data visualisation. We gathered qualitative feedback from experts about our use case visualisations, and compiled a summary of key takeaways as well as ideas for envisioned future improvements. The proposed design space, example visualisations and lessons learned aim to guide the design of tangible globes for data visualisation in AR.
DOI: https://doi.org/10.1145/3491102.3517715
Preprint: download
Presentation: watch
Tags: augmented reality,chi,design space,geovisualisation,globe,tangible
Motivation
Globes have been part our history for hundreds of years, serving us in a wide range of purposes. Nowadays, globes are available in different versions: from passionately crafted artisan globes to mass produced globes created to fill class rooms. They also come in various scales or physical sizes. While globes are fun to look at and interact with, little innovation has been done to enrich the user experience with them. This research actualises our vision of future globes experience enhanced by information-rich virtual objects in augmented reality.
Custom-made globes
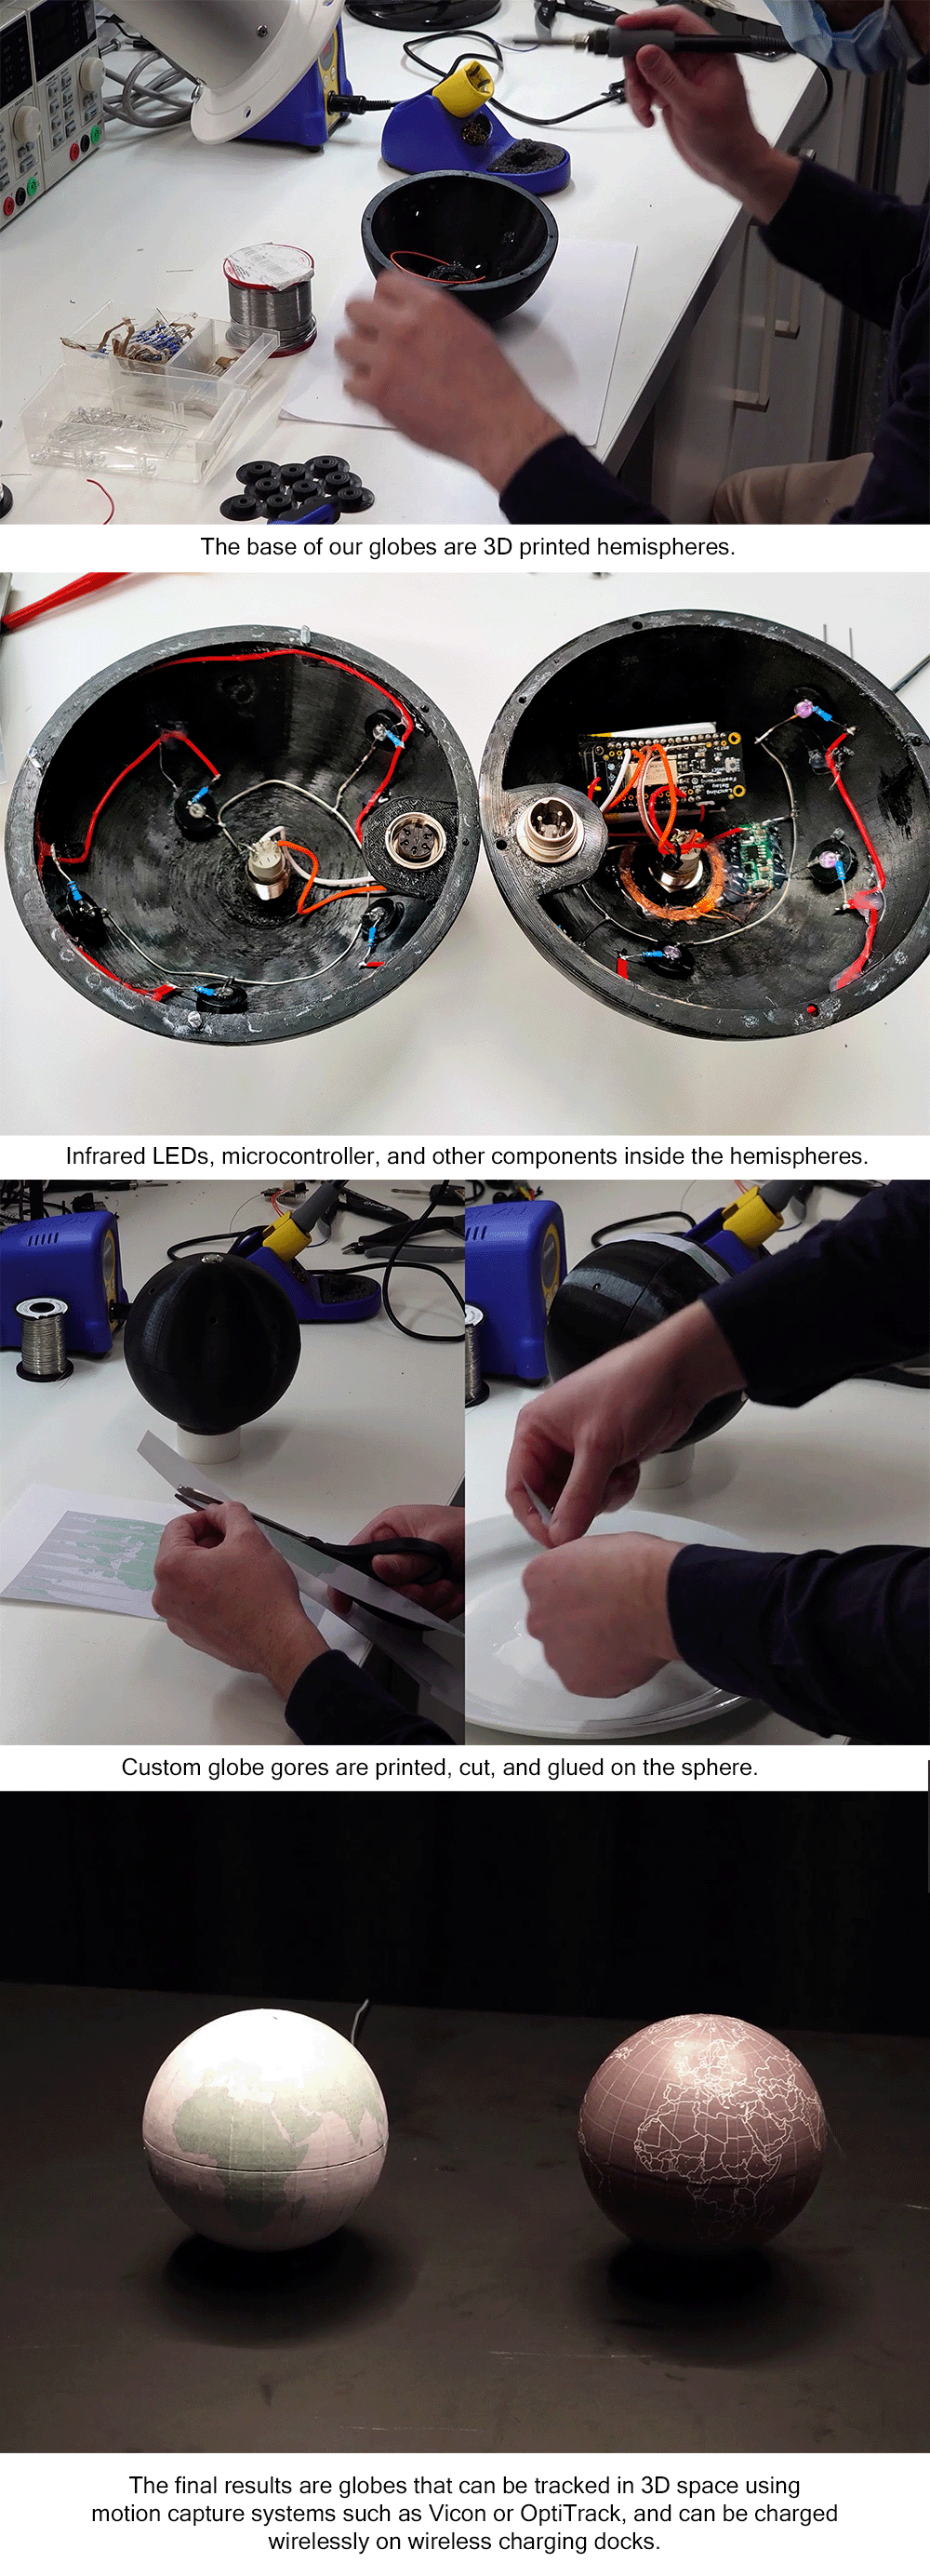
We created custom tangible globes that can be tracked in 3D space using a combination of a motion capture system and HoloLens 2. The globe has internal infrared LEDs, as opposed to standard marker-based motion tracking. This allows for a clean view of geographical information on the globe surface.

Exploring the tangible-virtual interplay of tangible globes + virtual data visualisations
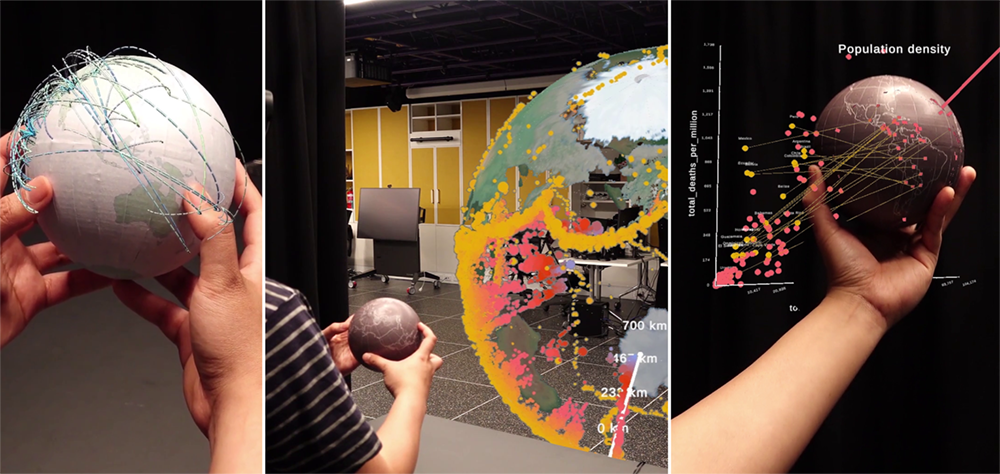
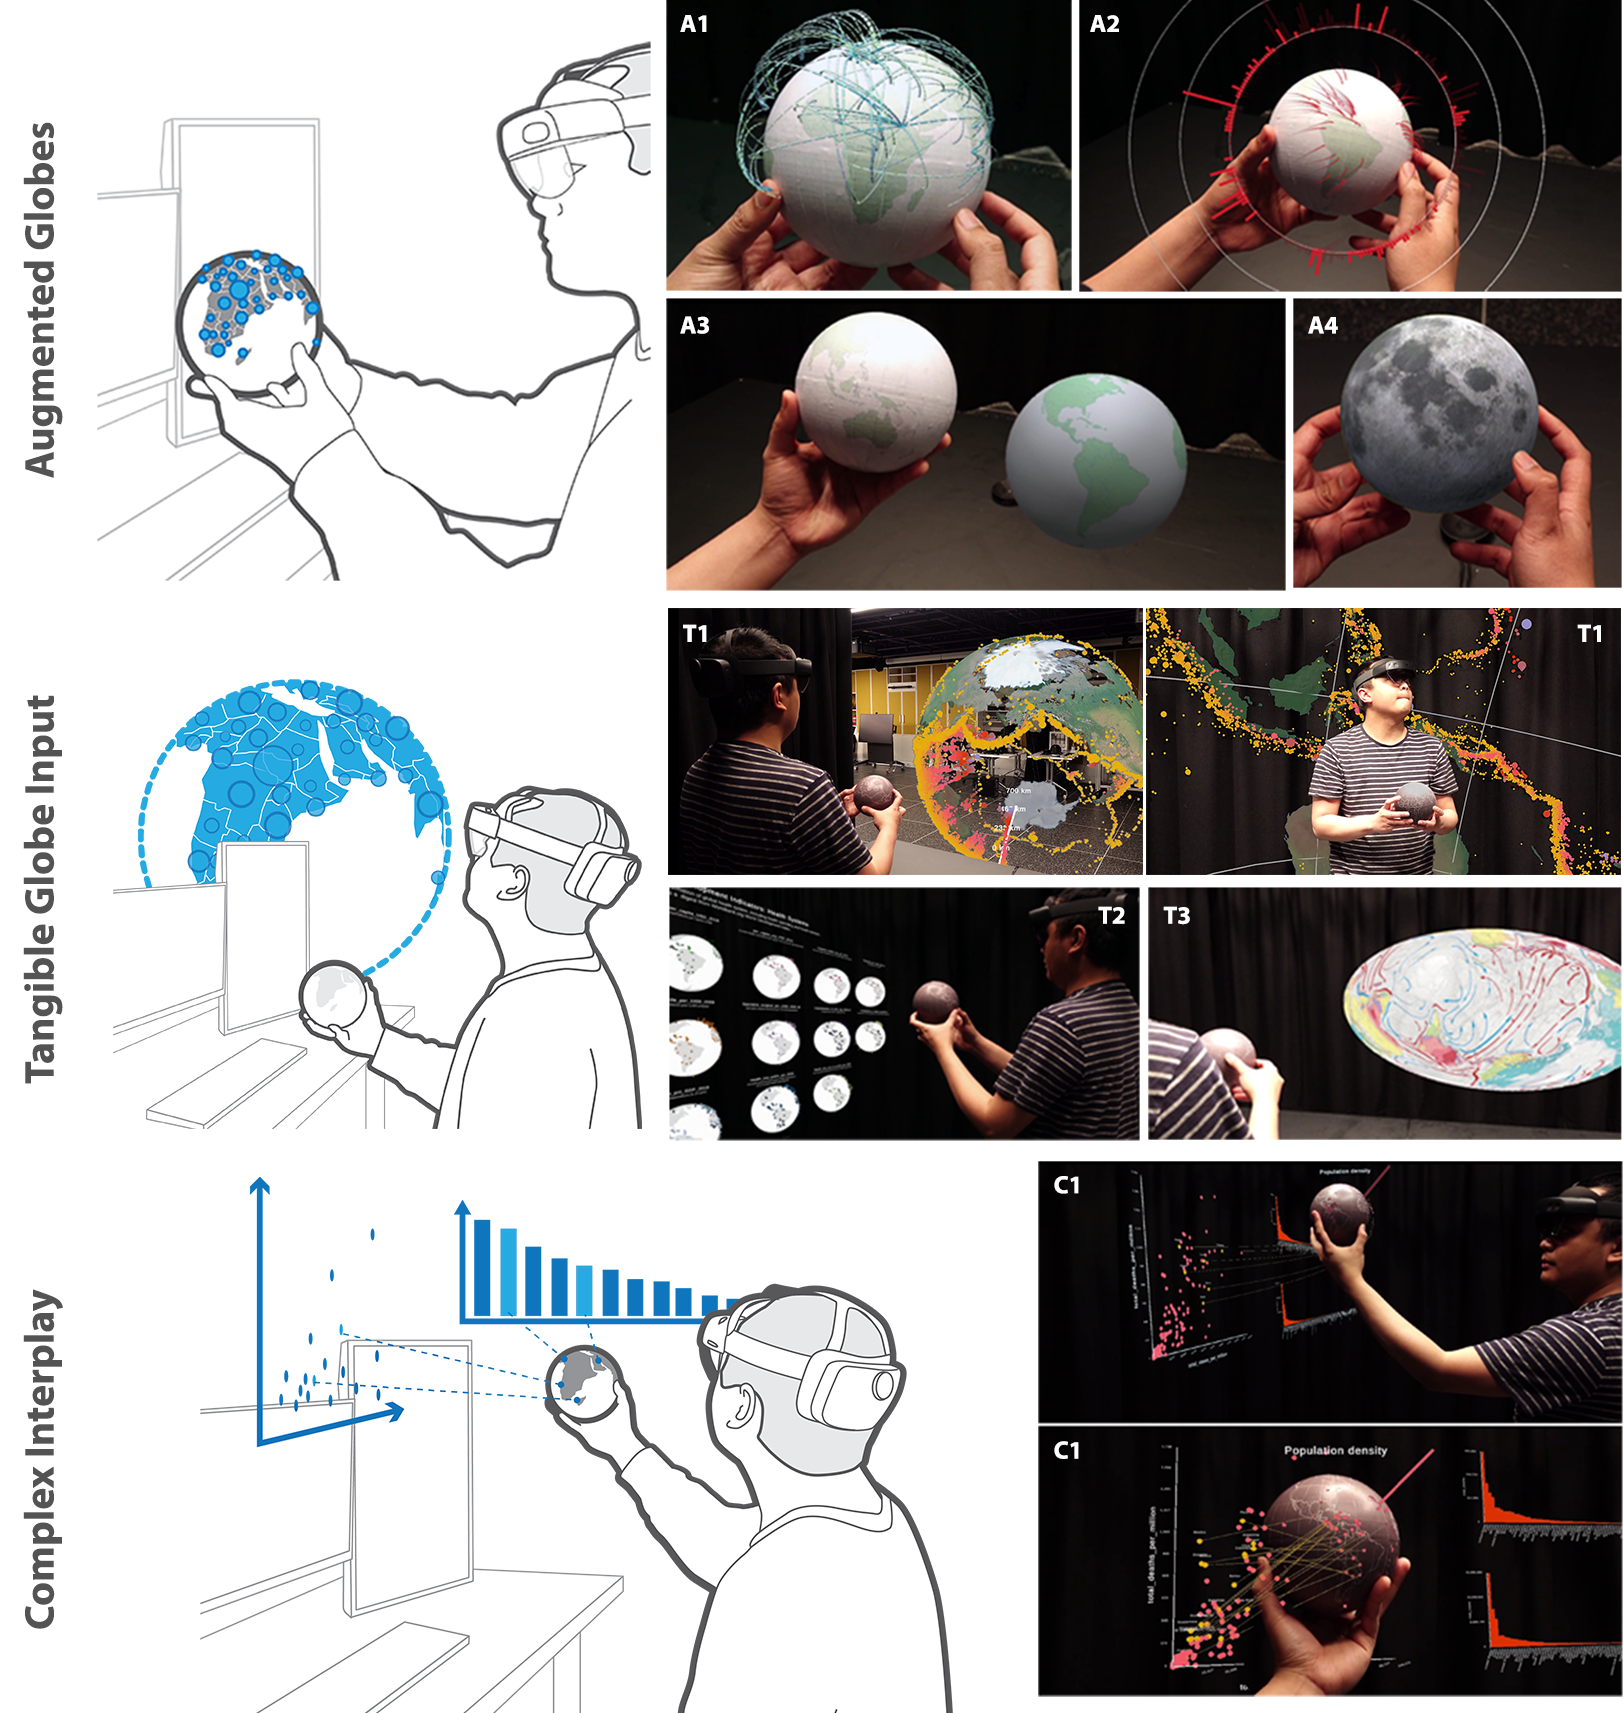
We explore the design space for combining virtual geographic information with tangible globes. Instantiations of this design space are presented as use cases that we group into three main categories: augmented globes, tangible globe input, and complex interplay, shown on the image below.

- A1 (Geographic Flows):
geographic marks above the surface of a tangible globe. - A2 (Composite Charts):
a diagram around a tangible globe. - A3 (Hidden Hemisphere):
a virtual thematic globe placed side-by-side with a thematic tangible globe. - A4 (Moon):
a virtual texture overlaying the surface of a tangible globe
- T1 (Exocentric and Egocentric Globe):
tangible globe as a means to control a large virtual thematic globe. - T2 (Small Multiples):
tangible globe as a means to control multiple 3D visualisations. - T3 (Spherical Rotation):
tangible globe as a means to control spherical rotation of a map projection.
C1 (Linked Charts):
the augmented globe held by the user provides geographical context of the data while other charts; such as scatter plots and bar charts; provide accurate visualisation idioms, and the link between the two type of representations create a complex tangible-virtual interplay.
Experience the use cases
Do you want to try these use cases in your lab? Refer to this repository: https://github.com/KadekSatriadi/Tangible-Globe-AR
Acknowledgment
This research project is supported by the Postgraduate Publication Award funding from the Faculty of Information Technology, Monash University, Australia. We would like to thank all experts we interviewed, Dr René Sieber, Dr Mark A. Harrower, Mr. Jorge Wagner, and Dr Yalong Yang, for their participation and insightful feedback.