
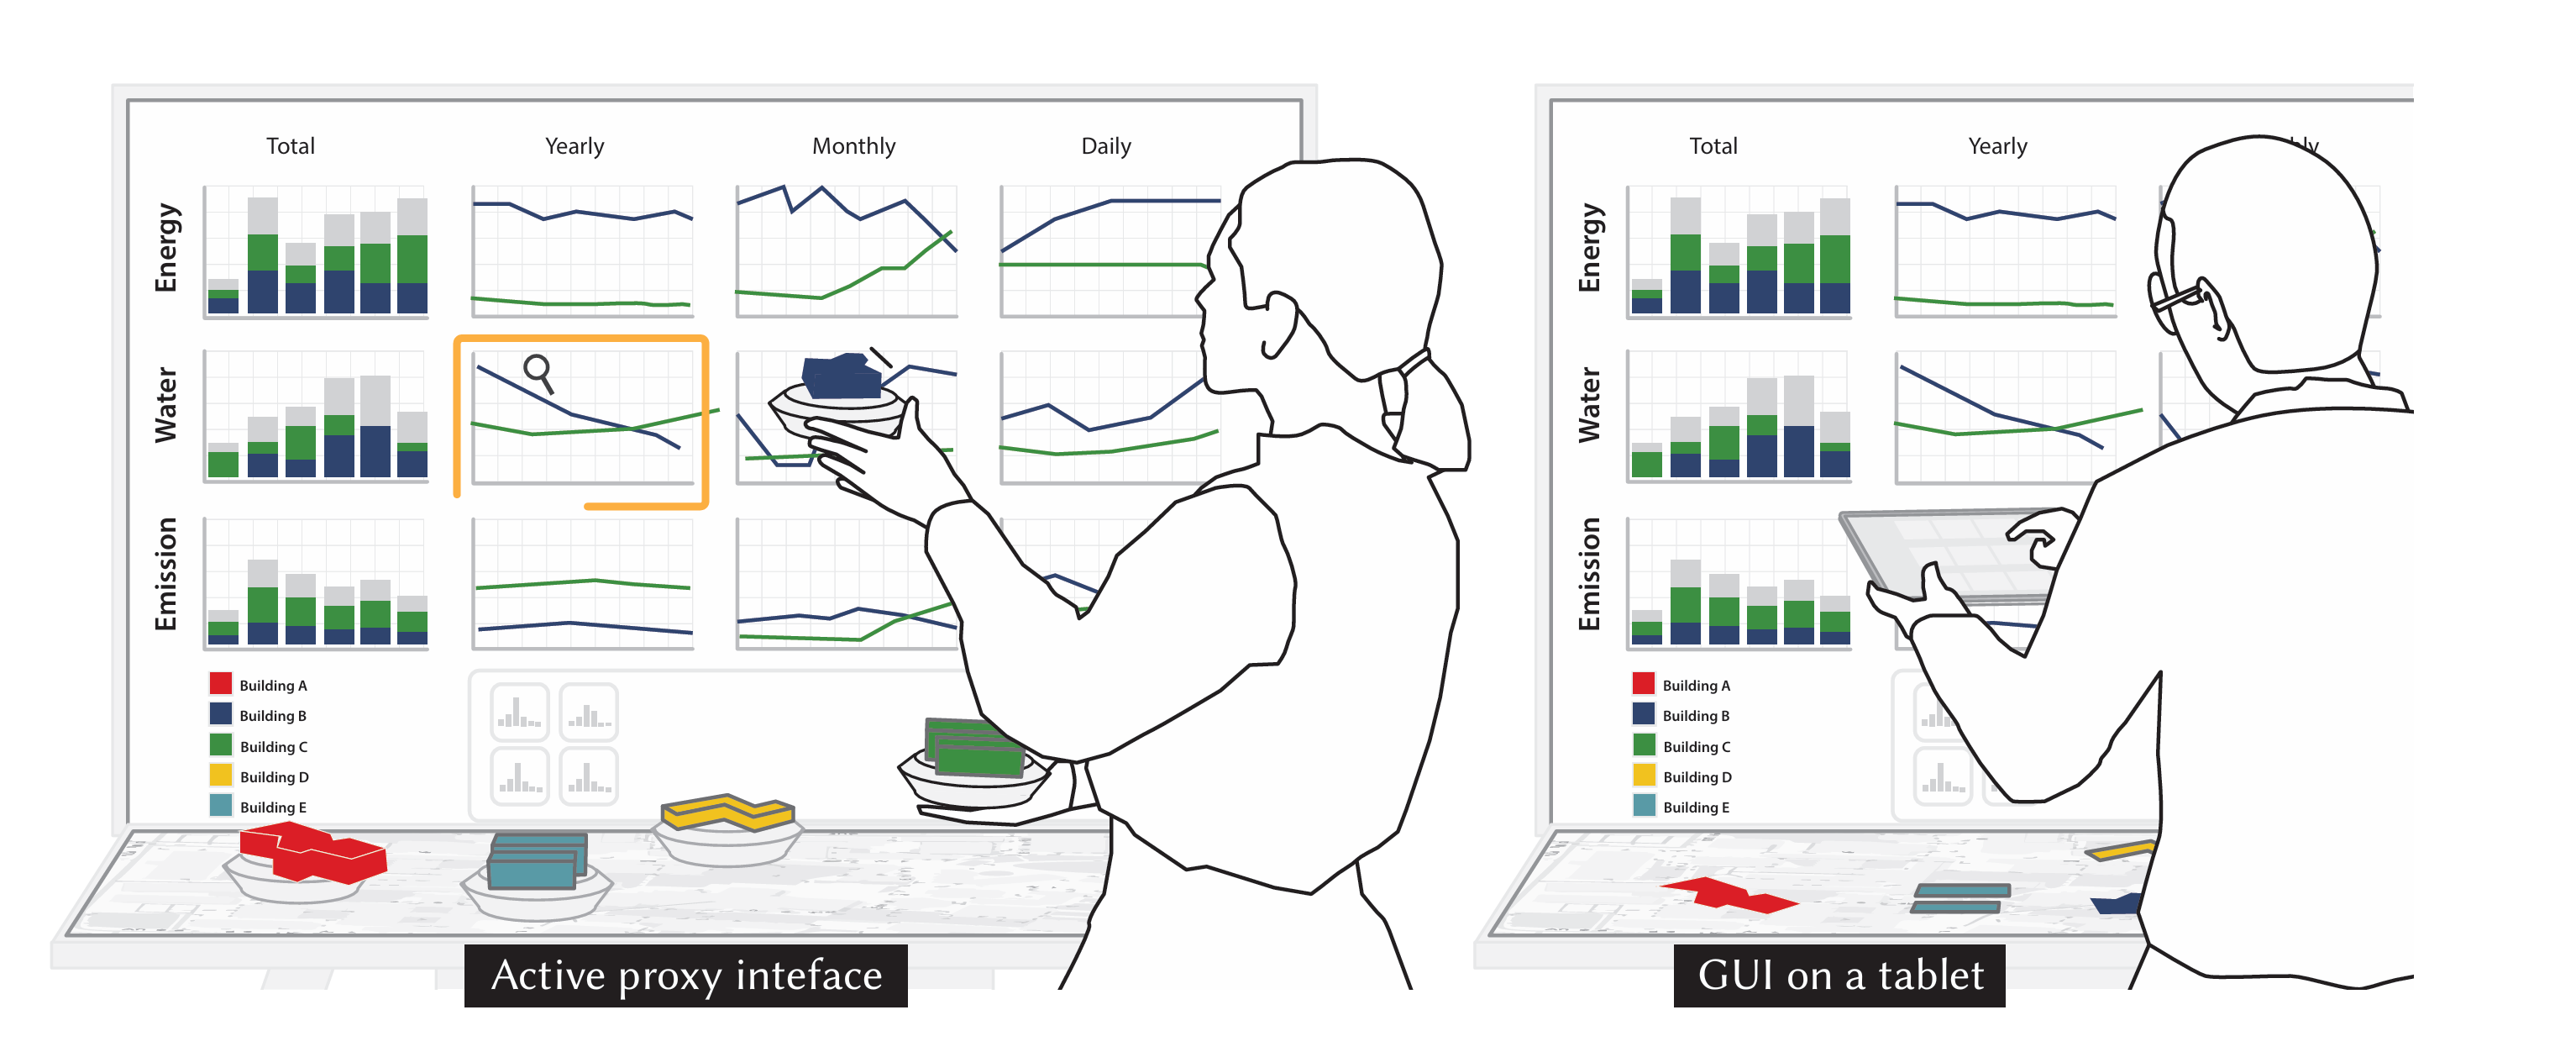
MarioChart: Autonomous Tangibles as Active Proxy Interfaces for Embodied Casual Data Exploration
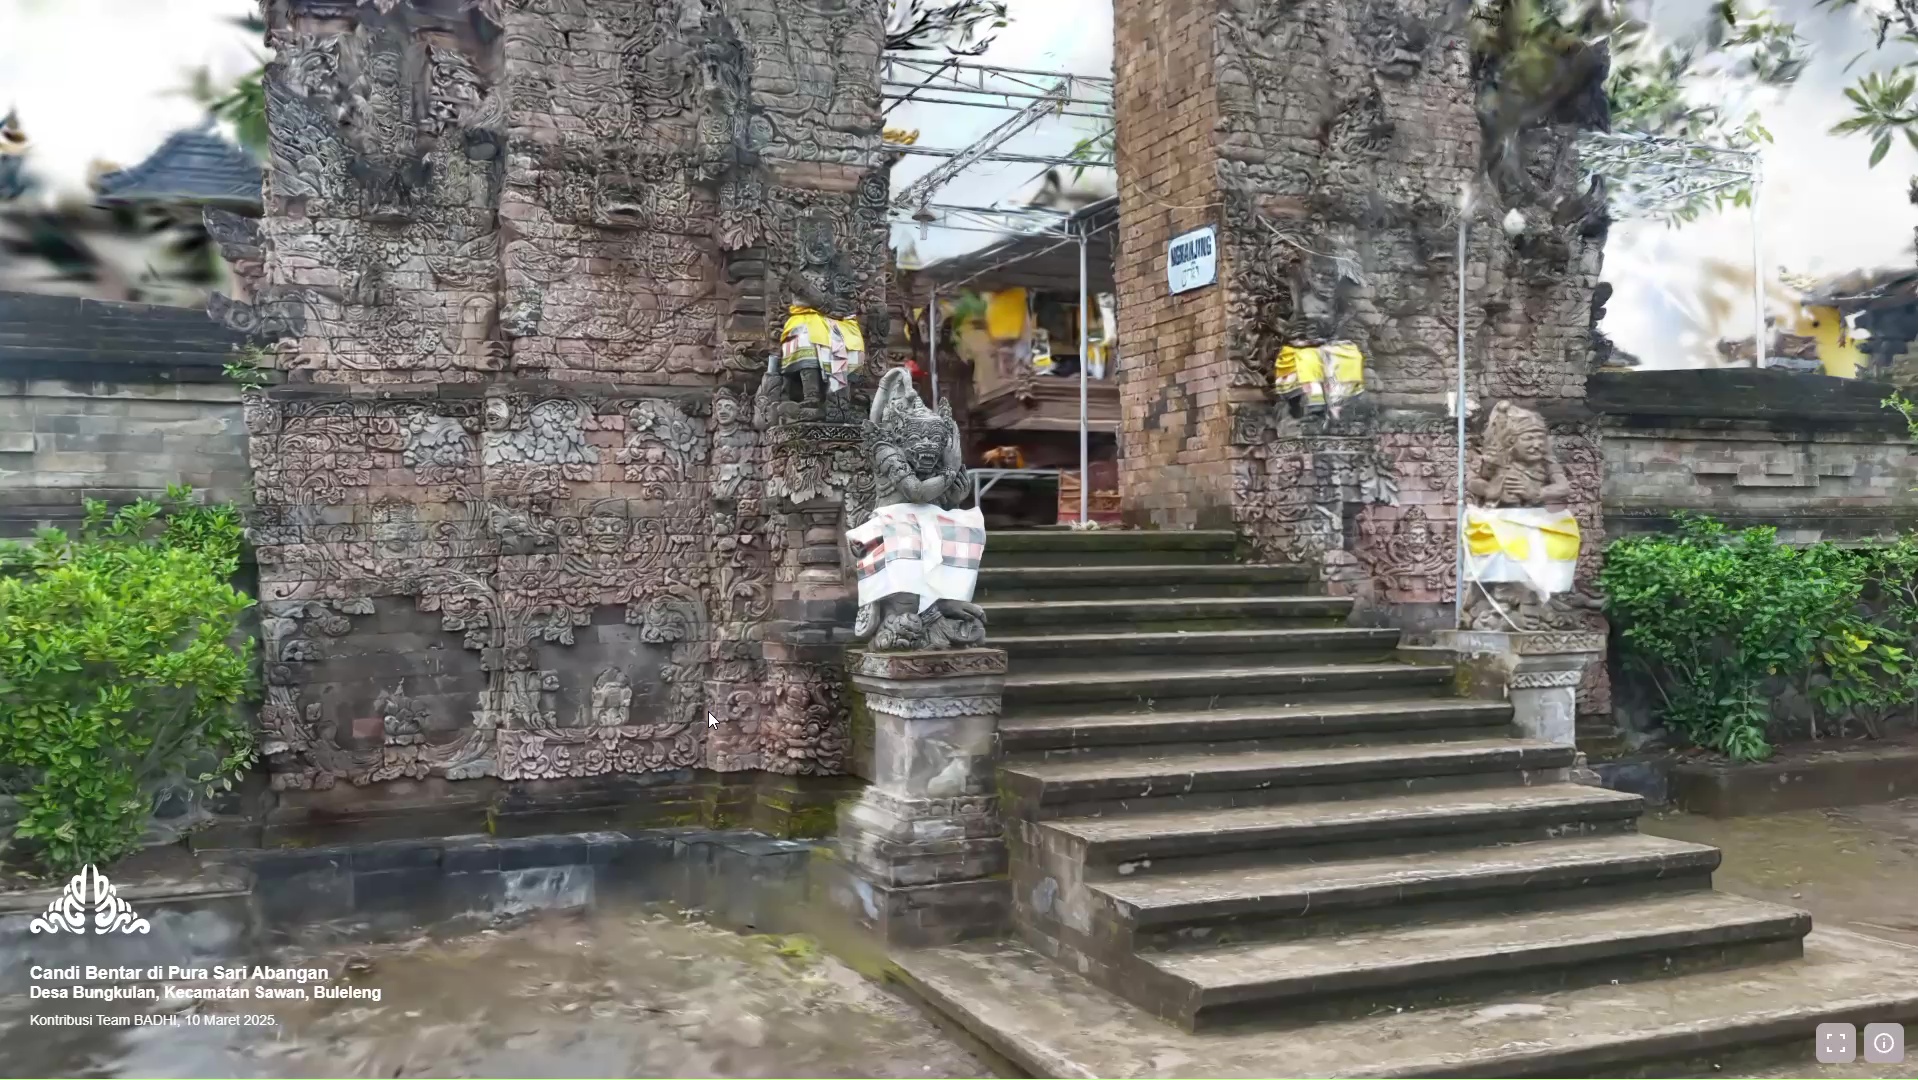
3D Gaussian Splatting for Archival of Balinese Temples from Community-Sourced Videos
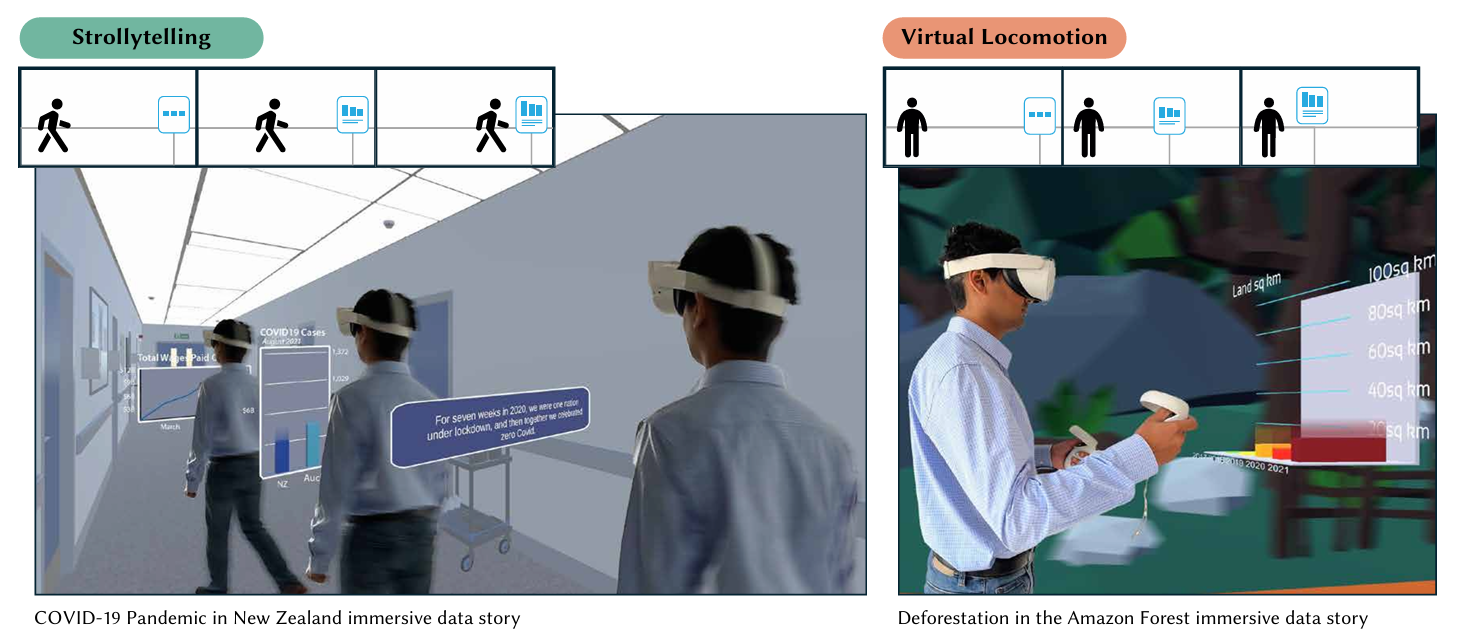
Strollytelling: Coupling Animation with Physical Locomotion to Explore Immersive Data Stories
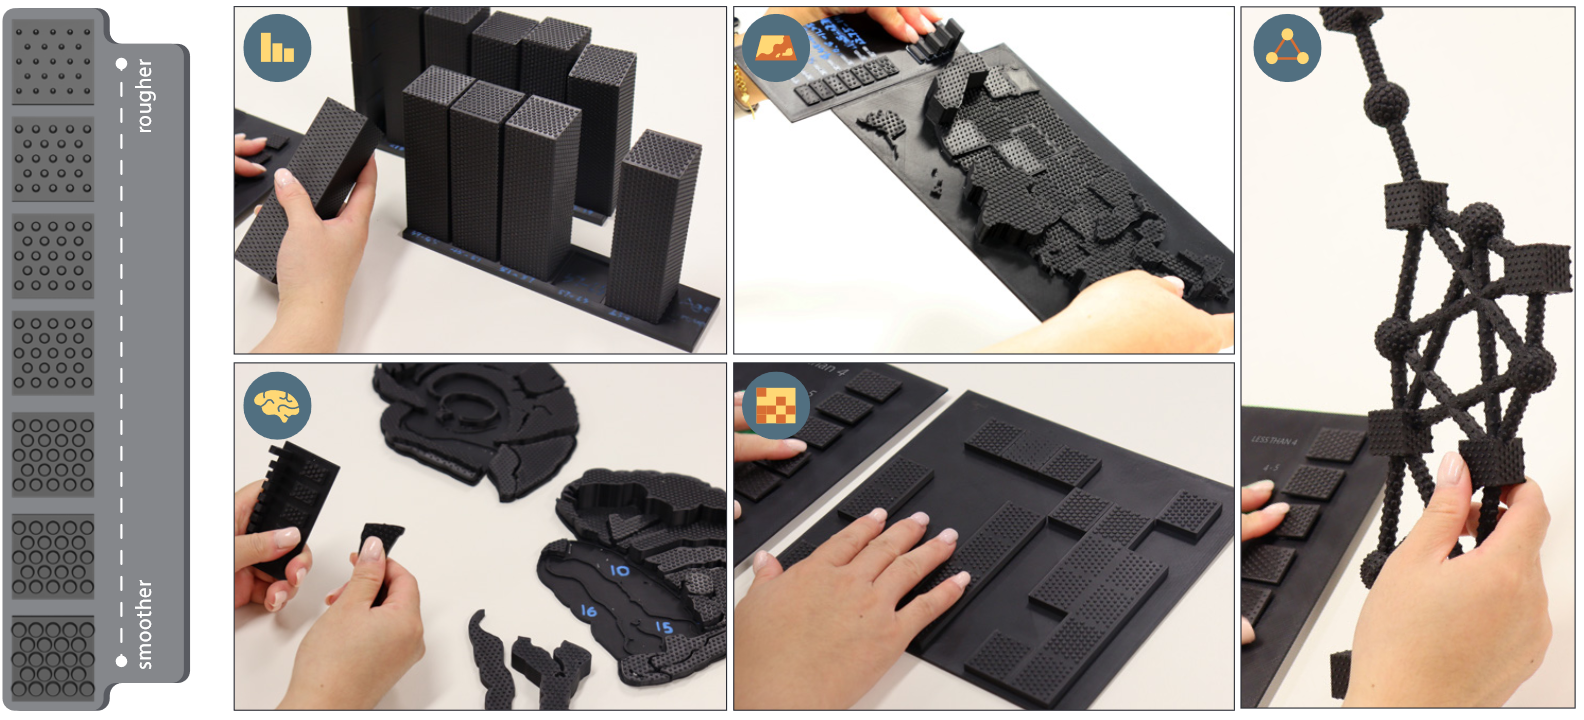
That's Rough! Encoding Data into Roughness for Physicalization

Active Proxy Dashboard: Binding Physical Referents and Abstract Data Representations in Situated Visualization through Tangible Interaction
Embodied Provenance for Immersive Sensemaking
ProxSituated Visualization: An Extended Model of Situated Visualization using Proxies for Physical Referents
Augmented Scale Models: Presenting Multivariate Data Around Physical Scale Models in Augmented Reality
Tangible Globes for Data Visualisation in Augmented Reality
Quantitative Data Visualisation on Virtual Globes

Maps Around Me: 3D Multiview Layouts in Immersive Spaces

Augmented Reality Map Navigation with Freehand Gestures
I am an HCI researcher and educator at Embodied Visualisation Group, Monash University, Australia. I am passionate about innovative computing technology applied to real-world problems for positive impacts. My research approach focuses on potential outcomes, small steps toward a well-defined long-term vision, and collaborative and interdisciplinary efforts. A large part of my work revolves around techniques for understanding data through visualisation and/or multi-sensory data representations enabled by spatial computing technologies.
Recent Publications
-
HandovAR: Towards AR and AI Support for ICU Nurse Handover
Mengxing Li, Phoebe Zhang, Jiazhou Liu, Agnes Haryanto, Kadek Ananta Satriadi, Trung Nguyen, Deval Mehta, Zerina Lokmic-Tomkins, and Tim Dwyer -
MarioChart: Autonomous Tangibles as Active Proxy Interfaces for Embodied Casual Data Exploration
Shaozhang Dai, Kadek Ananta Satriadi, Jim Smiley, Barrett Ens, Lonni Besançon, Tim Dwyer -
Anxiety-Free Public Dentistry for Adults With Disabilities by Using Head-Mounted Virtual Reality Technology: Protocol for a Feasibility Mixed Methods Study
Dung T Bui, Fiona McAlinden, Alice Urban, Charmine E J Hartel, Kristian Rotaru, Kadek Ananta Satriadi, Tanner Person, Wei Wang, Libby Callaway -
When Temples Travel: Towards Understanding Cultural Impacts of Visualizing Sacred Sites in Foreign Contexts
I. G. M. Darmawiguna, Kadek Ananta Satriadi, Thomas Chandler, Bernhard Jenny, Made Windu Antara Kesiman, Putu Hendra Suputra, and Kadek Teguh Dermawan -
Effects of Interface Layouts on Cognitive Performance for Pedicle Screw Placement Simulator in Immersive Environments
Lang Qin, Kadek Ananta Satriadi , Jiazhou Liu, Yuhan Zhan, Jiang Shao, Peimeng Liu, Zhiyong Chen, Yongtao Liu
Featured Projects

Selected Publications
MarioChart: Autonomous Tangibles as Active Proxy Interfaces for Embodied Casual Data Exploration
We introduce the notion of an Active Proxy interface, i.e. tangibles as proxies for a physical data referent, supporting interaction through active manipulation. We realise an active proxy interface system for data visualisation, MarioChart, using robot carts relocating themselves on a tabletop, e.g., to align with their data referents in a map or other visual layout.
Dai, S., Satriadi, K. A., Smiley, J., Ens, B., Besançon, L., & Dwyer, T. (2026, April). MarioChart: Autonomous Tangibles as Active Proxy Interfaces for Embodied Casual Data Exploration. In Proceeding 2026 CHI Conference on Human Factors in Computing Systems.
3D Gaussian Splatting for Archival of Balinese Temples from Community-Sourced Videos
We present a novel application of 3D Gaussian Splatting (3DGS) for the large-scale archival of thousands of temples in Bali. Our project, the Bali Digital Heritage Initiative, adopts a participatory approach in which local communities collect video footage of these vulnerable temples, which we transform into 3DGS scenes to serve as digital archives.
Wilson, A., Murtiyoso, A., Jenny, B., Darmawiguna, I. G. M., Suputra, P. H., Chandler, T., Kesiman, M. W. A., & Satriadi, K. A. (2025). 3D Gaussian splatting for archival of Balinese temples from community-sourced videos. IEEE International Conference on Imaging Systems and Techniques, Strasbourg, France.
Strollytelling: Coupling Animation with Physical Locomotion to Explore Immersive Data Stories
We propose and explore 'strolly'telling, a novel data storytelling technique that maps the story progression with the user/audience’s physical locomotion. Inspired by the conventional web-based technique for scrolling-based stories (i.e. scrollytelling), our technique tightly couples the user’s position in physical space to the animation frame of the data story. This technique leverages the natural tendency of humans to 'walk and talk' while telling a story and requires users to engage with the content actively.
Jain, R. P., Drogemuller, A., Satriadi, K. A., Smith, R., & Cunningham, A. (2025). Strollytelling: Coupling Animation with Physical Locomotion to Explore Immersive Data Stories. In Proceedings of the 2024 CHI Conference on Human Factors in Computing Systems (pp. 1-17)
That's Rough! Encoding Data into Roughness for Physicalization
While visual channels (e.g., color, shape, size) have been explored for visualizing data in data physicalizations, there is a lack of understanding regarding how to encode data into physical material properties (e.g., roughness, hardness). This understanding is critical for ensuring data is correctly communicated and for potentially extending the channels and bandwidth available for encoding that data. We present a method to encode ordinal data into roughness, validated through user studies.
Du, X., Satriadi, K. A., Drogemuller, A., Matthews, B. J., Smith, R., Walsh, J. A., & Cunningham, A. (2024, May). That's Rough! Encoding Data into Roughness for Physicalization. In Proceedings of the 2024 CHI Conference on Human Factors in Computing Systems (pp. 1-16).
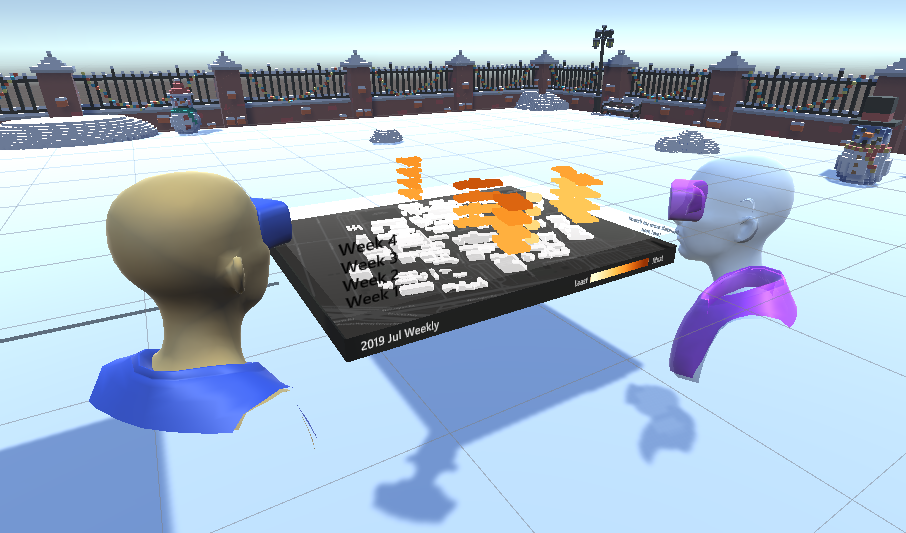
Active Proxy Dashboard: Binding Physical Referents and Abstract Data Representations in Situated Visualization through Tangible Interaction
We introduce a conceptual design space defining four quadrants as combinations of two dimensions: spatial to abstract representation; and passive to active proxy. Our focus is the novel quadrant defined by active proxies and abstract representations. Designing active proxy techniques is non-trivial as users are accustomed to common interaction modalities.
Satriadi, K. A., Ens, B., Goodwin, S., & Dwyer, T. (2023, April). Active Proxy Dashboard: Binding Physical Referents and Abstract Data Representations in Situated Visualization through Tangible Interaction. In Extended Abstracts of the 2023 CHI Conference on Human Factors in Computing Systems (pp. 1-7).
Embodied Provenance for Immersive Sensemaking
We propose the concept of embodied provenance, the use of three-dimensional space and embodied interactions in supporting recalling, reproducing, annotating and sharing analysis history in immersive environments. We propose a conceptual framework for embodied provenance by highlighting a set of design criteria for analytic provenance drawn from prior work and identifying essential properties for embodied provenance.
Zhang, Y., Ens, B., Satriadi, K. A., Yang, Y., & Goodwin, S. (2023, April). Embodied Provenance for Immersive Sensemaking. To be presented at ACM Interactive Surfaces and Spaces Conference.
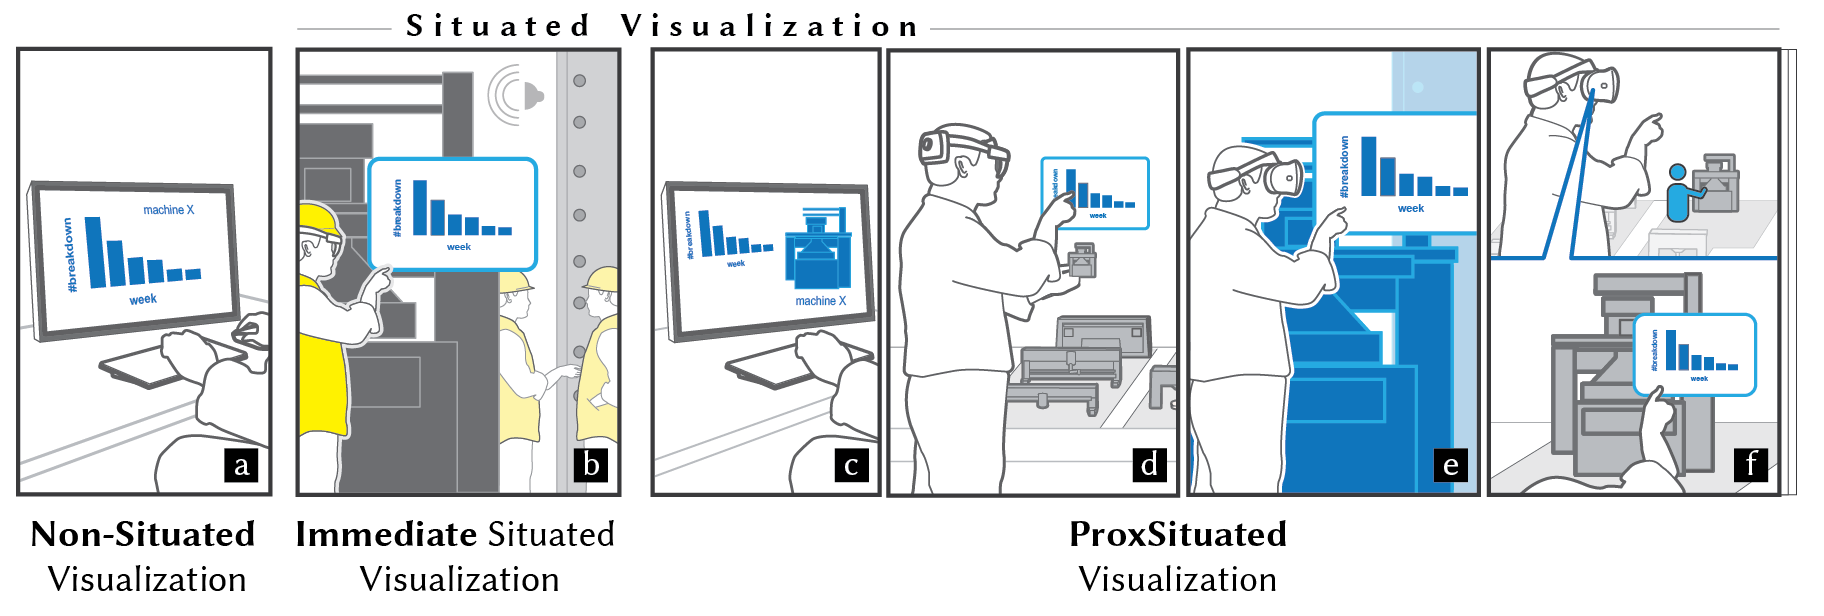
ProxSituated Visualization: An Extended Model of Situated Visualization using Proxies for Physical Referents
We propose an extended model of situated visualization that encompasses Immediate Situated Visualization and ProxSituated (Proxy of Situated) Visualization. Our model describes a set of key entities involved in proxSituated scenarios and important relationships between them. From this model, we derive design dimensions and apply them to existing situated visualization work.
Satriadi, K. A., Cunningham, A., Smith, R. T., Dwyer, T., Drogemuller, A., & Thomas, B. H. (2023, April). ProxSituated Visualization: An Extended Model of Situated Visualization using Proxies for Physical Referents. In Proceedings of the 2023 CHI Conference on Human Factors in Computing Systems (pp. 1-20)
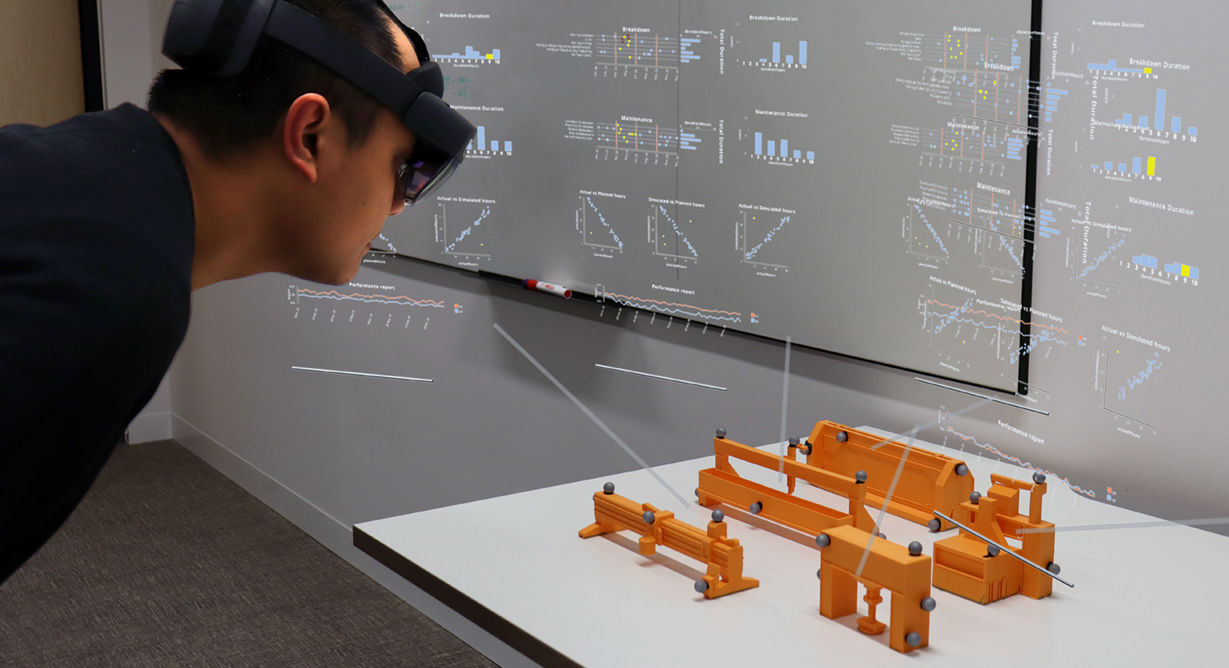
Augmented Scale Models: Presenting Multivariate Data Around Physical Scale Models in Augmented Reality
We present augmented scale models, immersive visualisations that place charts of multivariate data via Augmented Reality (AR) registered to physical 3D models. We identified two main factors for presenting AR charts in the limited display space around the models: 1) how charts are laid out (Slides vs Dashboard), and 2) how the chart views are arranged in the 3D space (On Scale Model, On Table, On Virtual Board).
Satriadi, K.A, Cunningham, A., Thomas, B.H., Drogemuller, A., Odi, A., Patel, N., Aston, C., & Smith, R.T. 2022. Augmented Scale Models: Presenting Multivariate Data Around Physical Scale Models in Augmented Reality. In IEEE International Symposium on Mixed and Augmented Reality, Oct 17 - 21 2022, Singapore.
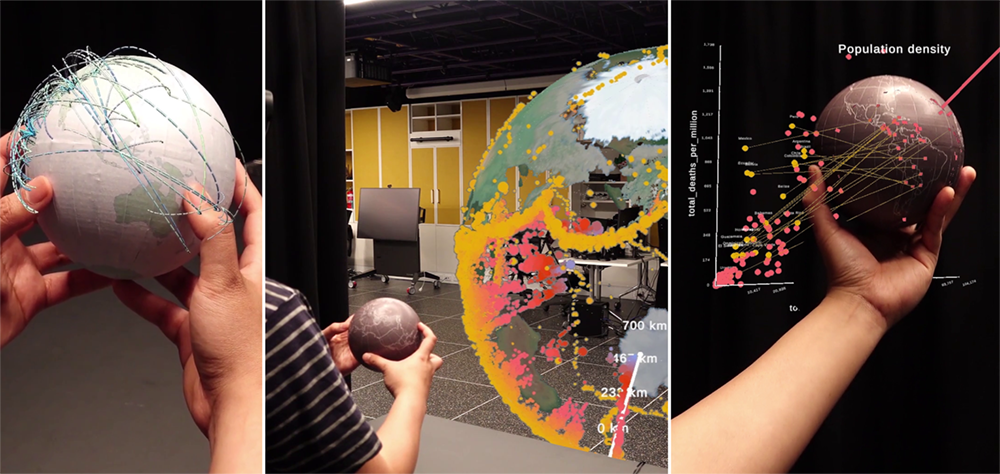
Tangible Globes for Data Visualisation in Augmented Reality
We explore the design space and use cases of tangible globe visualisation in AR. We created custom tangible globes that can be tracked in 3D space using a combination of a motion capture system and HoloLens 2. The globe has internal infrared LEDs, as opposed to standard marker-based motion tracking. This allows for a clean view of geographical information on the globe surface.
Satriadi, K.A., Smiley, J., Ens, B., Cordeil, M., Czauderna, T., Lee, B., Yang, Y., Dwyer, T., Jenny, B. 2021. Tangible Globes for Data Visualisation in Augmented Reality. In CHI ’22: ACM Conference on Human Factors in Computing Systems, April 30 - May 5 2022, New Orleans, USA. doi:10.1145/3491102.3517715
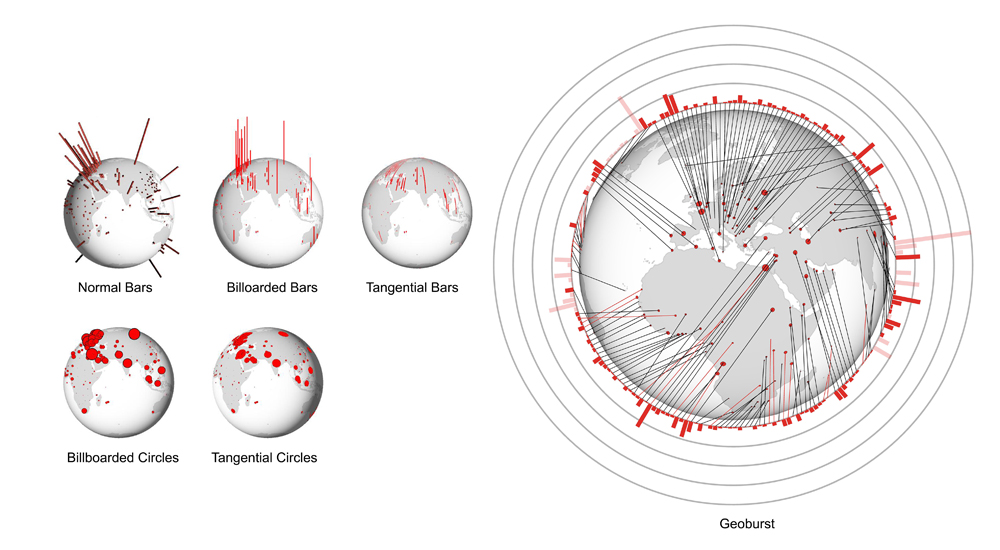
Quantitative Data Visualisation on Virtual Globes
We evaluated five different globe visualisation idioms and then proposed a new visualisation design. Geographic data visualisation on virtual globes is intuitive and widespread, but has not been thoroughly investigated. We explore two main design factors for quantitative data visualisation on virtual globes: i) commonly used primitives (2D bar, 3D bar, circle) and ii) the orientation of these primitives (tangential, normal, billboarded).
Satriadi, K. A., Ens, B., Czauderna, T., Cordeil, M., Jenny, B. 2021. Quantitative Data Visualisation on Virtual Globes. In CHI ’21: ACM Conference on Human Factors in Computing Systems, May 08–13, 2021, Yokohama, Japan. doi:10.1145/3411764.3445152
Maps Around Me: 3D Multiview Layouts in Immersive Spaces
We conducted a user study to obtain a better understanding of how users arrange immersive multiview maps. Visual exploration of maps often requires a contextual understanding at multiple scales and locations. Multiview map layouts, which present a hierarchy of multiple views to reveal detail at various scales and locations, have been shown to support better performance than traditional single-view exploration on desktop displays.
Satriadi, K. A., Ens, B., Cordeil, M., Czauderna, T., Jenny, B. (2020, November). Maps Around Me: 3D Multiview Layouts in Immersive Spaces. In Proc. ACM Hum.-Comput. Interact. 4, ISS, Article 201 (November 2020), 20 pages. doi:10.1145/3427329
Augmented Reality Map Navigation with Freehand Gestures
We evaluated freehand gestures design space for AR map navigation. Mid-air hand gesture interaction has long been proposed as a ‘natural’ input method for Augmented Reality (AR) applications, yet has been little explored for intensive applications like multiscale navigation. In multiscale navigation, such as digital map navigation, pan and zoom are the predominant interactions.
Satriadi, K. A., Ens, B., Cordeil, M., Czauderna T. , Willett, W., Jenny, B. (2019, March). Augmented reality map navigation with freehand gestures. In 2019 IEEE Conference on Virtual Reality and 3D User Interfaces (VR) (pp. 593-603). IEEE. doi:10.1109/VR.2019.8798340